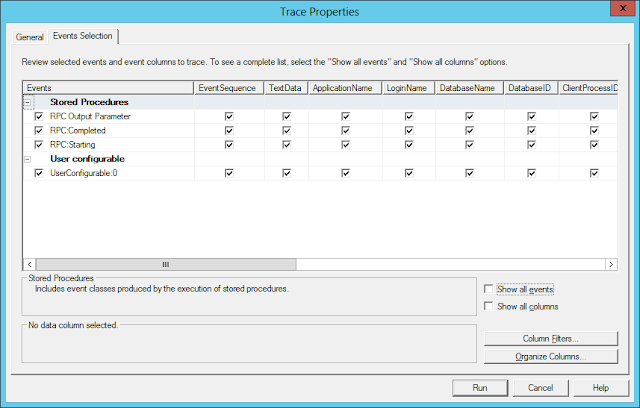
So how can we see the output value? If you use interactive tools such as SSMS, SQLCMD, this task is trivial. You can simply add PRINT or SELECT statement. But the problem is this statement does not print the value to SQL trace.
Obviously there is no standard trace event class that captures this kind of output, but we can use user defined event, so-called UserConfigurable event class, to get around this problem.
To create this event data from TSQL statement, we use sp_trace_generateevent which generates trace event with user defined text value (and binary value if specified).
The below GetNext SP has nested SP called GetNextNestedSP. Once the nest SP is called, we want to display OUTPUT parameter value to SQL trace.
CREATE PROCEDURE [GetNext]
( @p1 NVARCHAR(32), @p2 NVARCHAR(32))
AS
BEGIN
    DECLARE @out BIGINT
    DECLARE @text nvarchar(128)

    EXEC [GetNextNestedSP] @p1, @p2, @out OUTPUT

    SET @text = CONVERT(nvarchar(32), @out)
    EXEC master..sp_trace_generateevent  82, @text

    -- cut --
END
sp_trace_generateevent takes 3 parameters. First parameter is eventId for SQL trace. As MSDN says, this value is predefined and must be one of the event numbers from 82 through 91. ID 82 corresponds to [UserConfigurable:0] in SQL Profiler event class. 2nd parameter is text string that we want to send to SQL trace. This can be any string but there is a string length limitation (MSDN: 128 chars). 3rd parameter is optional binary data if needed. So when this SP (GetNext) is called from client application, how can we capture user defined event in SQL Profiler?


No comments:
Post a Comment